Calibrating a monitor
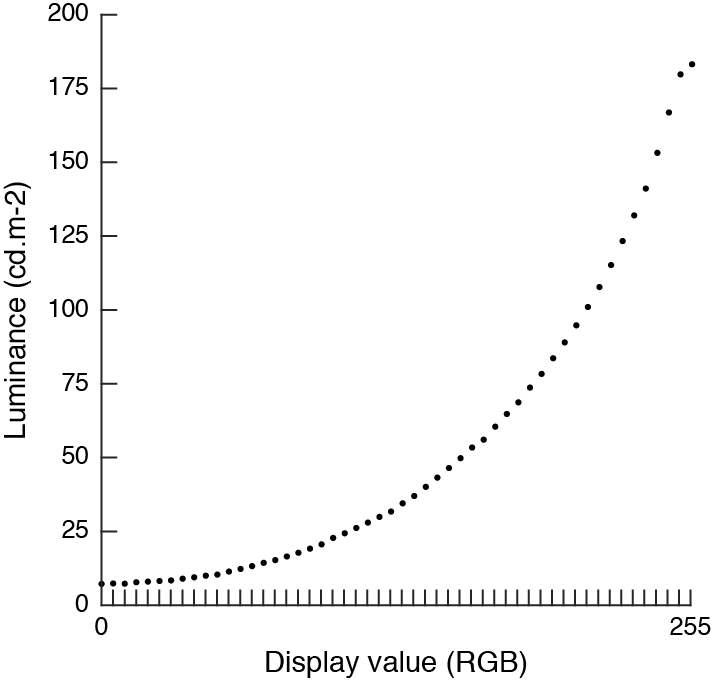
Radiant energy (luminance) outputted by monitors is not linearly related to input voltage. Historically, this was caused by cathode ray tubes (CRT displays). In vision science, one usually prefers to know precisely what luminance is being displayed, which requires calibrating a monitor. For example, below is the luminance, in cd.m-2, of a SONY Trinitron CRT for 52 RGB values. The maximum luminance (RGB=[255,255,255]) is 183cd.m-2. Because of the monitor non-linearity when half this value is requested ([127,127,127]), the monitor actually outputs 32cd.m-2, not even 20% of the maximum luminance. So if, for example, I wanted to display 2 disks with 33% positive and negative Michelson contrast relative to a mid-level background, the dark disk would actually have a 44% contrast and the bright disk would have a 70% contrast. This is clearly undesirable. Calibrating the luminance of monitor is very easy: it requires only to measure luminance at different values, then invert this function to linearize outputted luminance as a function of display value. Calibrating a monitor for colors is more intricate and requires a bit of algebra.
Luminance calibration
Calibrating luminance is relatively straightforward. All it requires is a photometer, ideally one such as the Konika Minolta LS-150 Luminance Meter. If accuracy is not critical, cheaper alternatives will do like the X-rite i1-Pro Display. I don't know whether these 2 products are better than others, I cite them only because I used them. Be careful as some of these cheap products do not have a SDK allowing you to explicitely request measurements. For example, the i1-Pro display does not, except for the OEM version from VPixx Technologies (although, there is a trick to still use the non-OEM version).
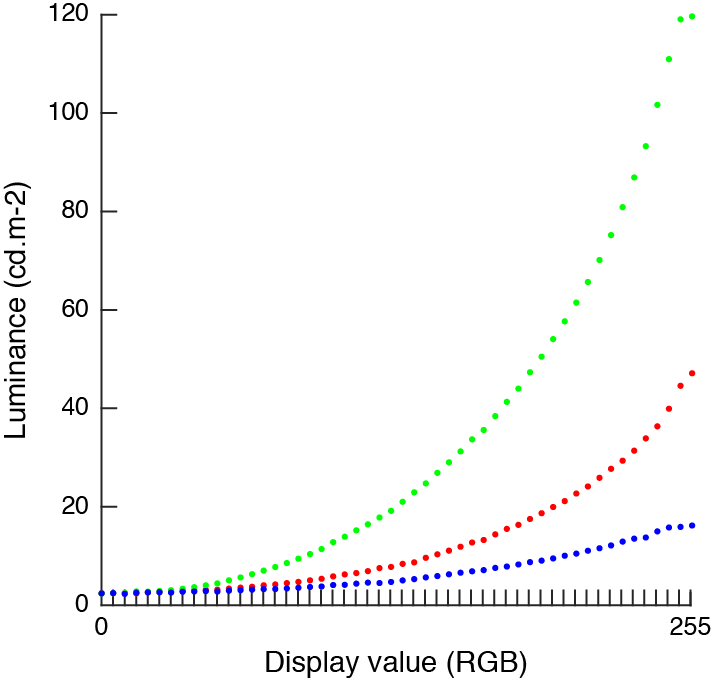
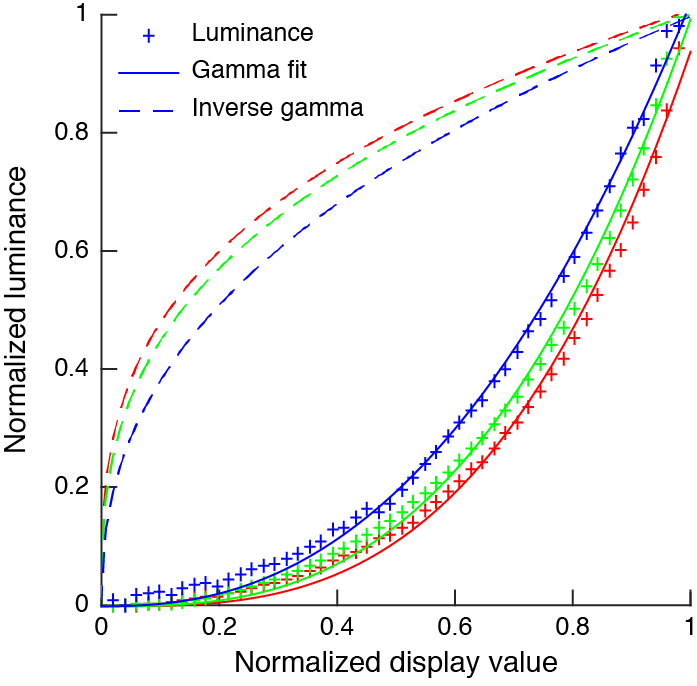
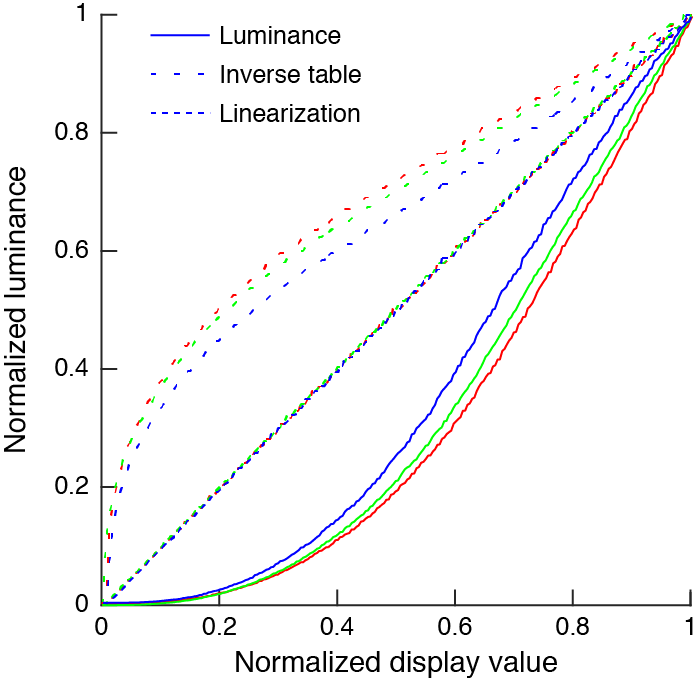
If possible, it is best to make a luminance measurement for all 256 display value for all 3 color channels. Most luminance meters today can interface with a computer so this can be done conveniently. But for old luminance meters, measurements must be made by hand which takes a lot of time. Typically you will find that the green color gun outputs about 60% of a gray value, the red gun 30% and the blue gun only 10%. First you have to normalize these the display and luminance values. Then, if you have measurements for all display values you can directly invert these values so as to have a linear output. If you have only few measurements, you will have to fit a function to the data and use the function inverse to build a inverse table. For this, people usually use a so-called gamma function, or power law: $$L = \alpha V^{\gamma}$$ The inverse function is: $$V = \left(\frac{L}{\alpha}\right)^{\frac{1}{\gamma}}$$ The first figure below shows luminance values for the 3 color channels of the SONY Trinitron CRT display. The second figure shows normalized luminance for the same display, the fitted gamma funtions and their inverse. The luminance values follow approximately a gamma function so a reasonable calibration can be made from a limited number of data points. The last figure shows luminance values for a bad LCD monitor. As you can see luminance does not follow a gamma function so linearizing the monitor this way would not be very good. But using all 256 measurements, it is still possible to build a look-up table to linearize the display almost perfectly (note that you could also use picewiese linear functions to interpolate between measurement values). Actually this calibration is more linear than the one from SONY monitor.
Color calibration
Making measurements
Color calibration is more intricate. It also requires a color meter. Color meters measure luminance just like luminance meters, but they also make these measurements through color filters and can report xy chromaticity. The Konika CS-150 (but not the LS-150) is a color meter, as well as the X-rite i1-Pro Display. The color meter will most likely report the Yxy values derivated from the CIE 1931 color space. The CIE 1931 is a linear transformation of the LMS (cones) stimulations. The Yxy values are normalized by the luminance. $$x = \frac{X}{X+Y+Z}\qquad y = \frac{Y}{X+Y+Z}\qquad z = \frac{Z}{X+Y+Z}$$ Only the $x$ and $y$ are required for chromaticity because the $z$ value can be recovered from $z=1-x-y$. The CIE XYZ color space was designed so that the Y axis corresponds to the luminance axis. To calibrate the monitor in color, first the Yxy values for all 3 channels at maximum display must be measured, giving the following 9 values: $$xyz_{r} = \begin{bmatrix} x_{r}\\ y_{r}\\ z_{r} \end{bmatrix}\qquad xyz_{g} = \begin{bmatrix} x_{g}\\ y_{g}\\ z_{g} \end{bmatrix}\qquad xyz_{b} = \begin{bmatrix} x_{b}\\ y_{b}\\ z_{b} \end{bmatrix}$$
Derivating the LMS color space
Then convert these values to LMS values using the Smith-Pokorny estimate: $$M_{c2l} = \begin{bmatrix} +0.15514 & +0.54316 & -0.03286\\ -0.15514 & +0.45684 & +0.03286\\ 0 & 0 & +0.01608 \end{bmatrix}$$ $$R_{lms} = M_{c2l}\begin{bmatrix} x_{r}\\ y_{r}\\ z_{r} \end{bmatrix}\qquad G_{lms} = M_{c2l}\begin{bmatrix} x_{g}\\ y_{g}\\ z_{g} \end{bmatrix}\qquad B_{lms} = M_{c2l}\begin{bmatrix} x_{b}\\ y_{b}\\ z_{b} \end{bmatrix}$$
Derivating the DKL color space
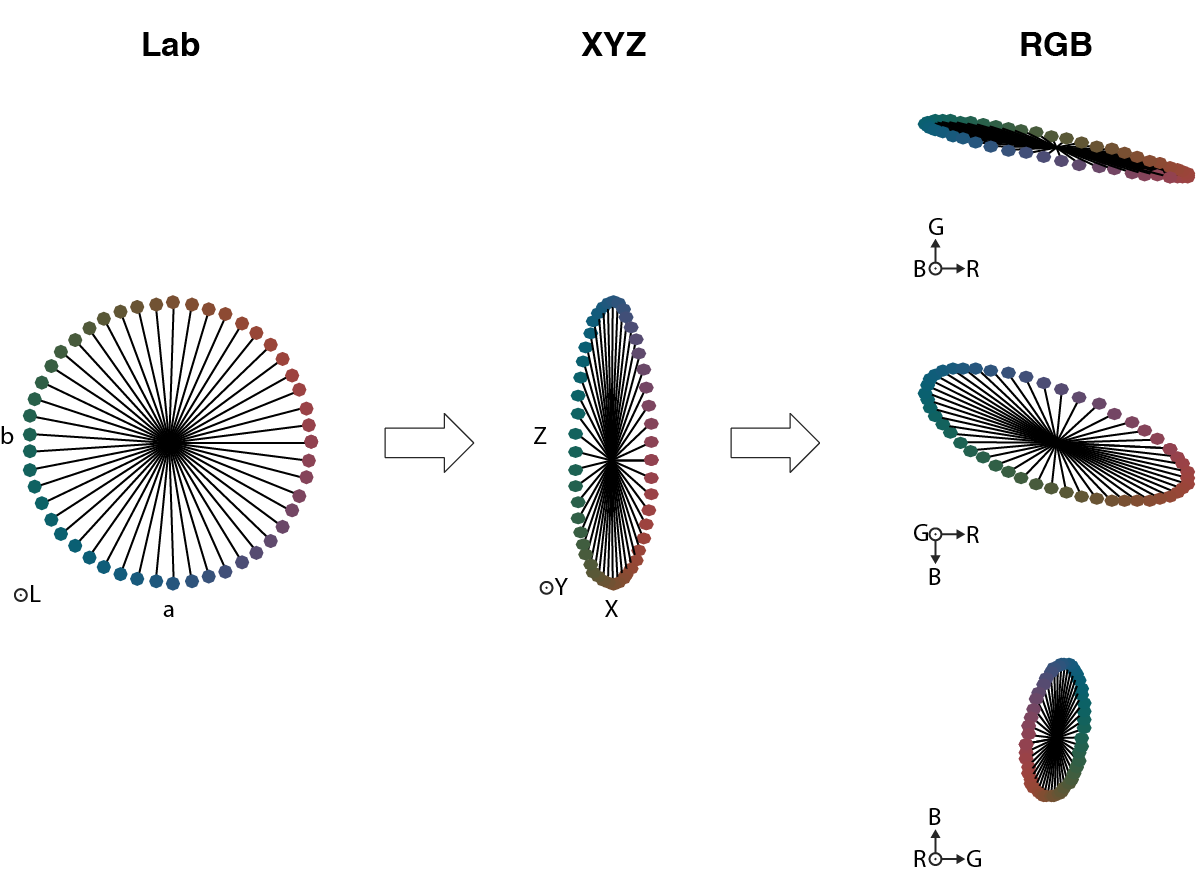
Derivating the CIE Lab color space
$$\left\{ \begin{array}{lr} L=116f\left(\frac{Y}{Y_r}\right)-16\\ a=500 \left[f\left(\frac{X}{X_r}\right)-f\left(\frac{Y}{Y_r}\right)\right]\\ b=200\left[f\left(\frac{Y}{Y_r}\right)-f\left(\frac{Z}{Z_r}\right)\right] \end{array}\right.$$